

New coal pillar strength formulae considering the effect of interface friction
Simon Heru Prassetyo, Muhammad Alen Irnawan, Ganda Marihot Simangunsong, Ridho Kresna Wattimena, Irwandy Arif, Made Astawa Rai
Mining Engineering Program, Institut Teknologi Bandung, Indonesia
https://doi.org/10.1016/j.ijrmms.2019.104102
Highlights
- Coal pillar strength formulae considering the interface friction are developed.
- The new formulae are compared against stable and unstable pillar cases.
- The linear-low friction formula provides best representation of field data.
- SF = 1.5 is suggested when using the new linear-low friction formula.
- It is safe to assume the coal/roof and coal/floor interfaces have low friction.
Abstract
Coal pillars perform the vital function of sustaining the weight of the overburden and protecting the entries and crosscuts during mine development and production. The strength of coal pillars is known to be greatly influenced by the friction of coal/roof and coal/floor interfaces. Unfortunately, none of the current empirical formulae for pillar strength has considered the effect of this so-called interface friction. This paper develops new coal pillar strength formulae considering the effect of interface friction. The formulae, which are in linear and power forms, are derived based on a series of UCS tests on coal specimens at three different interfaces (high: c = 124 kPa and μ = 0.40; medium: c = 76 kPa and μ = 0.22; and low: c = 55 kPa and μ = 0.13) and at ten width-to-height (w/h) ratios (w/h = 2–8, 10, 12, and 16). Having compared the formulae against stable and unstable pillar cases from different areas around the world, this paper finds that: (1) the low-friction formula of the linear form provides the best representation of the pillar cases database; (2) to improve pillar strength prediction, a safety factor = 1.5 is suggested to be used for all pillar designs using the linear low-friction formula (except for USA coal pillars with w/h ≤ 6 that need a higher SF up to SF = 2.5); (3) when the friction of the coal/roof and coal/floor interfaces is not known, it is beneficial to assume that the interface has a low friction value and thus to use the linear-low friction formula to predict pillar strength.
Keywords: Coal pillar strength formulae, Width-to-height ratio, Interface friction, Safety factor
1. Introduction
In underground coal mines, coal pillars play a major role in sustaining the weight of the overburden and protecting the stability of the entries and crosscuts during mine development and production, allowing the miners to safely extract the coal.1 Due to these vital functions, the coal pillar has become one of the most fascinating subjects in the field of rock mechanics, particularly in the field of ground control. Ground control engineers seek to design coal pillars in a cost-effective way by minimizing their dimension without sacrificing the stability of the entries or gateroads. A few meters’ reduction of a typical chain pillar width in longwall mine may be an attractive incentive in today’s high-production longwalls.2
A classical approach to coal pillar design involves the following three steps: (1) pillar load estimation (usually calculated using the tributary area method), (2) pillar strength estimation (calculated from the available empirical pillar strength formulae), and (3) safety factor calculation (calculated as the ratio of pillar strength to pillar load). To comply with the tributary area method, the pillar load in this paper is referred to as the average pillar stress that is calculated as the ratio between the average overburden stress before excavation and the tributary area. The tributary area is defined as the cross-sectional area of an overburden block above the pillar and is a summation of the pillar cross-sectional area and the excavated area. The excavated area is defined as the rectangular area around the pillar that is formed by the half-width of entries and cross-cuts.
Because achieving a stable pillar design is essential to creating a safe underground working environment, extensive laboratory work, in situ tests, and numerical simulations have been conducted in the past few decades to characterize coal pillar strength. From this research effort, most ground control researchers have agreed that the strength of a coal pillar increases with the pillar’s width-to-height (w/h) ratio. Therefore, w/h ratio or pillar dimension has become the major parameter for determining coal pillar strength. However, are we satisfied with the current practice of determining pillar strength based merely on pillar dimension?
On the other hand, coal pillar failure, whether it is violent or not, occurs mainly because the load applied to the pillar is beyond its strength. In laboratory scale, the strength of coal specimens is greatly influenced by the following two parameters: (1) the friction between specimen and machine platens and (2) the specimen size. Unfortunately, among ground control researchers, the contribution of the former to coal pillar strength has attracted less attention than the latter.
1.1. . Empirical coal pillar strength formulae
For the past few decades, ground control researchers have developed many coal pillar strength formulae, with a general agreement that the strength of a coal pillar increases with the pillar’s width-to-height (w/h) ratio. There are two general types of expressions for predicting the strength of a cubical coal pillar: the linear formula in Eq. (1) and the power formula in Eq. (2):
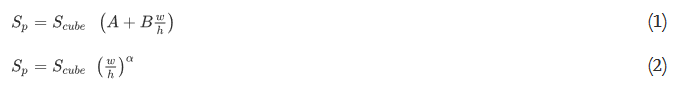
where Sp is the coal pillar strength, Scube is the strength of a cubical coal pillar at w/h = 1, w and h are the width and the height of the coal pillar, respectively, and α, A, and B are the constants. There is also an exponential form of the pillar strength formula based on a linear logistic regression model from coal pillar stability data.3However, this exponential formula is not considered in this paper.
Table 1 presents the list of empirical formulae for determining the strength of coal pillars in the linear and power forms. These formulae were developed from many coal fields around the world and are listed in chronological order. It should be noted that, in the derivation of their pillar strength formulae, the coal source and the machine specification that were used by the developers for coal testing are not reviewed in this paper. However, it is believed that such in-depth review would benefit ground control practitioners to fully comprehend and appreciate the significance of each of the existing empirical pillar strength formulae.
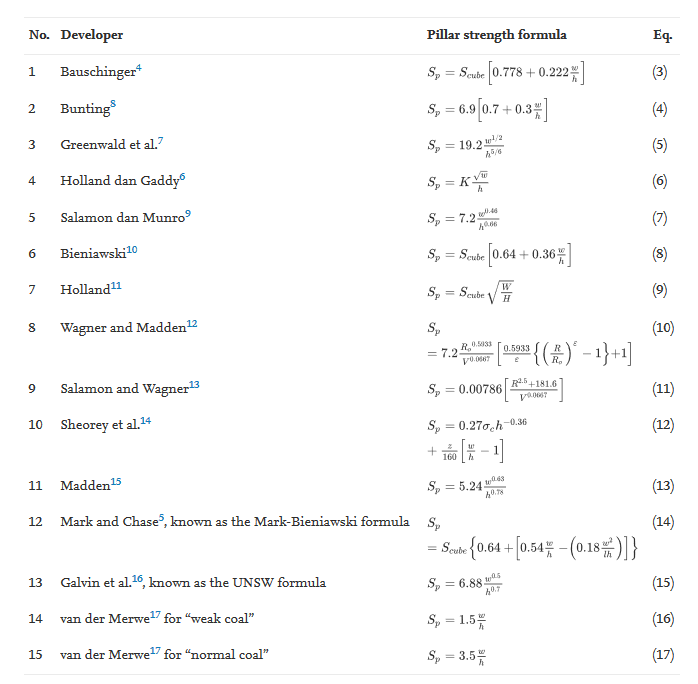
Table 1. Empirical formulae for determining coal pillar strength.
As expected, all pillar strength formulae in Table 1 are functions of pillar dimension as represented by either the w/h ratio or the absolute value of the individual dimension (i.e., w, h, l, and V). In Table 1, K is the Gaddy factor depending on the characteristic of the coal tested, σc is the uniaxial compressive strength (UCS) of the coal specimen (MPa), R is the w/h ratio, Ro is the critical w/h ratio, V is the pillar volume (m3), ε is the rate of increase of pillar strength, z is the depth cover (m), and l is the pillar length (m).
Fig. 1 compares several representative pillar strength formulae among those listed in Table 1. This comparison uses pillar height h = 2.1 m. The values of Scube are varied among developers and are shown in Table 2. For the linear formulation, the Bauschinger4 and Mark-Bieniawski5 formulae predict the lowest and the highest pillar strength, respectively. Meanwhile, for the power formulation, the Holland and Gaddy6 and Greenwald7 formulae predict the lowest and the highest pillar strength, respectively. However, in general, the predicted strengths of coal pillars are bounded by the predicted strengths of the Holland and Gaddy6 power formula (lower bound) and the Mark-Bieniawski5 linear formula (upper bound).
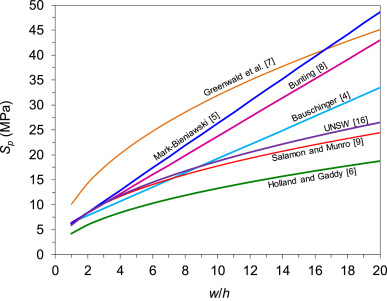
Fig. 1. Comparison of several representative coal pillar strength formulae.
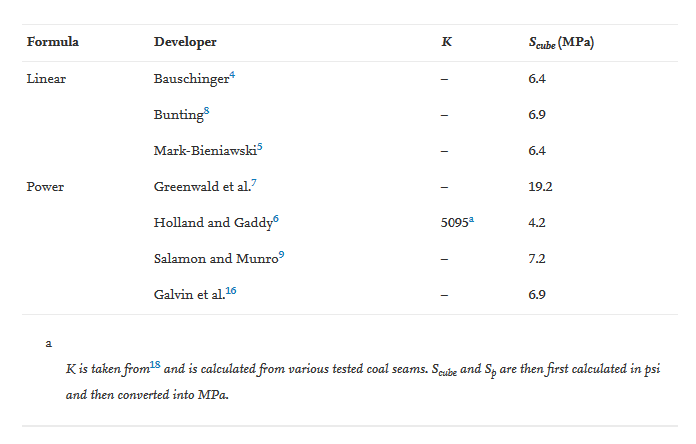
Table 2. Scube and K for several representative coal pillar strength formulae.
1.2. . Effect of interface friction on coal pillar strength
Whether it is violent or not, coal pillar failure occurs simply because the load applied to the pillar is beyond the pillar’s strength. In addition to the pillar dimension, the other factor that affects pillar strength is the friction at the coal/roof and coal/floor interface (Fig. 2), known as the interface friction. 1In the laboratory setting, the strength of coal specimens in the uniaxial compressive strength (UCS) test is greatly influenced by the friction between the specimen and the machine platens and by the specimen w/h ratio.19, 20, 21, 22, 23, 24, 25, 26
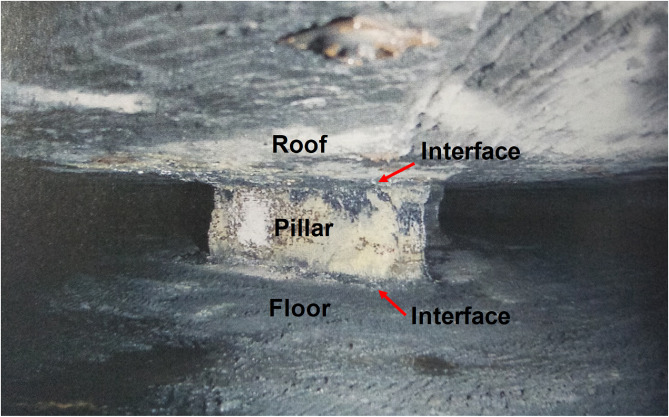
Fig. 2. A coal pillar in between coal/roof and coal/floor interfaces, modified from .27
To see the effect of interface friction and w/h ratio on the strength of coal specimens, Fig. 3 presents the stress-strain curves of coal specimens tested with UCS tests at different interface frictions and w/h ratios. These curves are re-constructed from studies22,23 that investigated the effect of interface friction and the w/h ratio of coal pillars on the occurrence of coal mine bumps by means of UCS tests on coal specimens from West Virginia (WV) and Utah (UT).
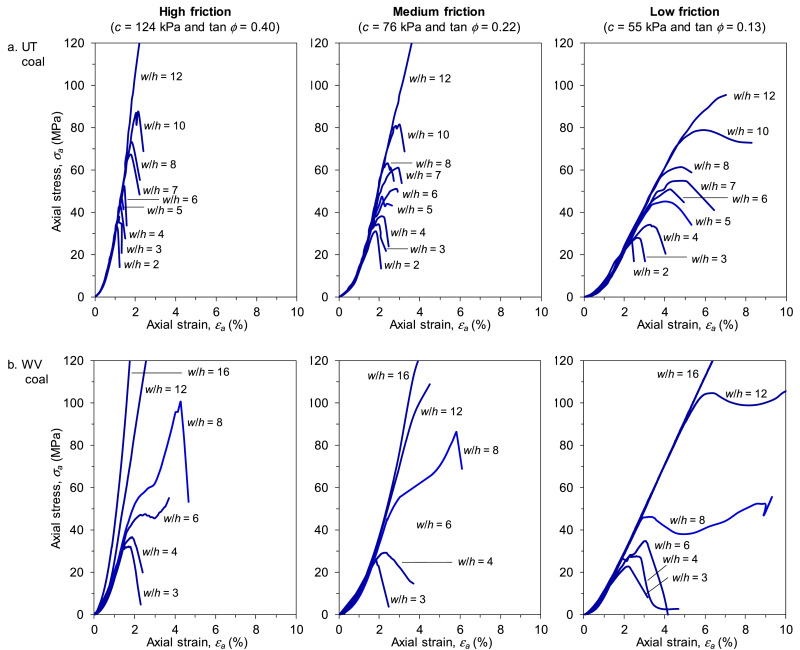
Fig. 3. Stress-strain curve of UCS tests on coal specimens at different interface frictions and w/h ratios22,23
The key message from Fig. 3 is that with the increase of w/h ratio and interface friction, the stress-strain curves tend to go from brittle to elastic-plastic behavior. In particular, the specimens’ post-failure behavior changes from a complete failure to failure and then strength regaining or to strain hardening after yielding, indicating a trend of increasing specimen strength.
Fig. 4 shows a typical division of the four friction zones identified on the top end-surface of coal specimens after UCS tests. 22,23The core zone is defined as the highly-confined zone that shows no friction marks that indicate movement experienced on its surface during the history of loading. The intermediate zone is defined as the zone that experiences only slight friction as indicated by the whitish or light-dark scratches on its surface. The transition zone experiences intense friction as indicated by the reddish scratches on its surface. Lastly, the rib zone has no or very little confinement as it is exposed directly to the free face.
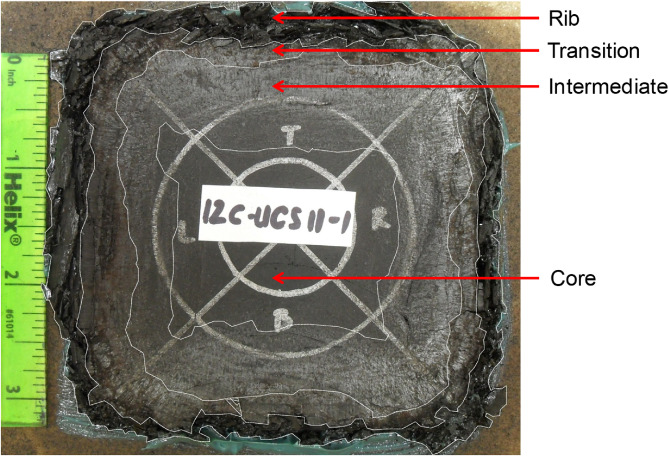
Fig. 4. The four friction zones identified on the top end-surface of a coal specimen after uniaxial loading22,23
Regarding the four friction zones in Fig. 4, previous studies22,23 have also found that, at high interface friction, the coal samples tend to store more energy in the core zone. At low interface friction, the energy is more easily dissipated to create fractures in the specimen ribs or the rib zone. This behavior is in accordance with Fig. 5 that shows that for both UT and WV coals, regardless of the interface friction, there are opposite trends of the percent area between the core and rib zones with increasing w/h ratios. The percent area of each friction zone is calculated as the ratio of the area of each friction zone to the total area of the coal specimen after failure.
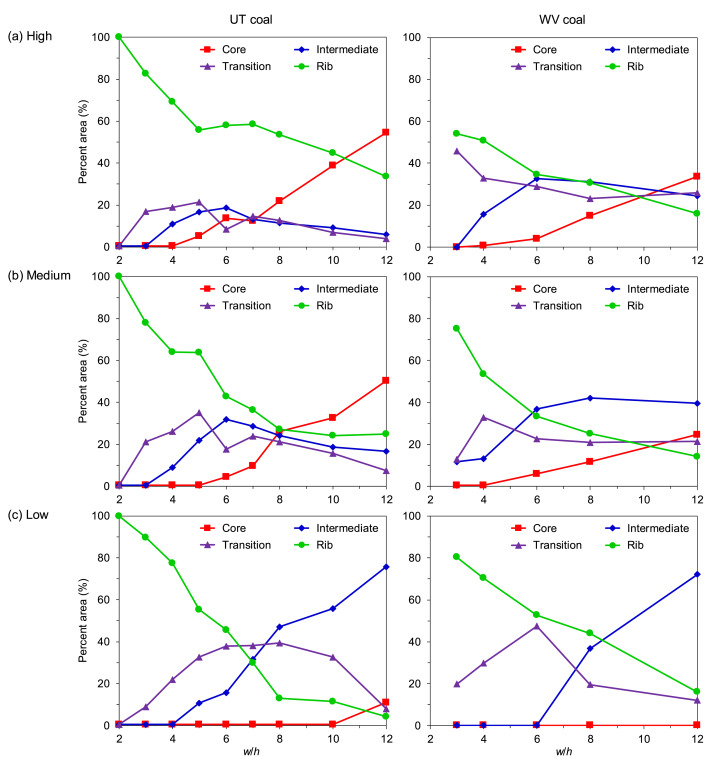
Fig. 5. The average percent area of each friction zone at each w/h ratio and interface friction22,23
Consequently, the rib zone may fail shortly after the compressive load is applied. Cracks propagate progressively from this zone toward the transition zone, exposing the transition zone to new free faces. At any interface friction, the average percent area of the core zones shows an increasing trend with increasing w/h ratios, while the opposite is observed for the rib zones. Since the core zone is highly confined, the trends observed in Fig. 5 indicate that confinement developed within a coal specimen increases with increasing w/h ratio but decreases with decreasing interface friction. When the end-platen exhibits high interface friction (Fig. 5a), the percent area that the core zone occupies is 54% for UT coal and 34% for WV coal. Conversely, when the end-platen exhibits low interface friction (Fig. 5c), the percent area that the core zone occupies is only 11% for UT coal and 0% for WV coal.
Even though confinement has been the subject of many investigations on the strength of coal pillars, the findings of this study show physical proof of the confinement experienced by the coal specimens. In addition, the relationships between the confinement around the pillar core and failure types from this study are also in agreement with those observed in other studies.28, 29, 30
1.3. . Objectives of the paper
Thus, it is clear that the strength of coal specimens is not only affected by the w/h ratio but also by the interface friction. Even though it is not explicitly stated, the existing coal pillar strength formulae in Table 1 may have considered the existence of friction between the coal/roof and coal/floor interface. However, the influence of this interface friction has not been quantitatively obtained from either in-situ tests or laboratory tests of coal specimens to derive the corresponding pillar strength formulae.
To fill this gap, the objectives of this paper are twofold: (1) to develop linear and power formulae of coal pillar strength considering the effect of interface friction and (2) to compare the developed formulae against a database of stable and unstable pillar cases from South Africa, the USA, India, and Australia.
2. Developing pillar strength formulae considering the effect of interface friction
2.1. . UCS tests of coal specimens
The formulae are developed based on the results of UCS tests on 178 coal specimens conducted at three different interface frictions (high, medium, and low) and ten width-to-height (w/h) ratios (w/h = 2–8, 10, 12, and 16) as appears in Refs. 22,23. The three interface frictions were created using three interface contacts during the UCS tests. The contacts were Contact 1: coal/sandstone (regarded as high friction); Contact 2: coal/grease-lubricated sandstone (regarded as medium friction); and Contact 3: coal/grease-lubricated steel (regarded as low friction). Each contact surface was tested with a direct shear test machine to determine its friction value (cohesion c and tan φ or μ). The friction values for each interface contact are as follows: Contact 1 (high friction) has c = 124 kPa and μ = 0.40; Contact 2 (medium friction) has c = 76 kPa and μ = 0.22; and Contact 3 (low friction) has c = 55 kPa and μ = 0.13.
Fig. 6a shows the arrangement of the UCS test on a coal specimen under Contact 1 (high friction), while Fig. 6b presents the scatter plot of the UCS test results for all coal specimens at different interface frictions and w/h ratios that serve as the main data used in this paper. Only the UCS tests from the medium and low frictions up to w/h = 12 are used for further analysis in this paper. Preliminary regression analysis on the high friction results (not shown in this paper) leads to a very low correlation coefficient. Hence, the high friction results are discounted from the analysis.
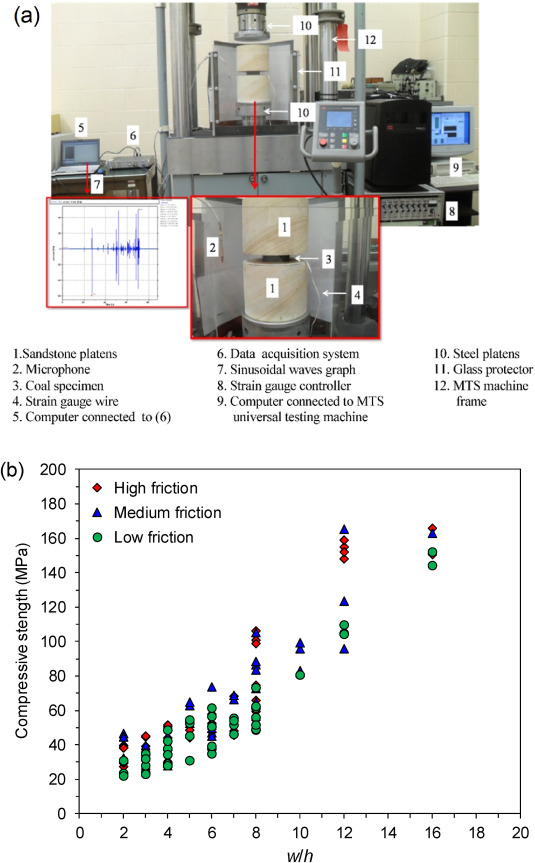
Fig. 6. (a) Arrangement of the UCS test of a coal specimen under Contact 1: high friction and (b) UCS test results of all coal specimens at different interface frictions and w/h ratios22,23
2.2. . Regression and normalization of the UCS test results
Linear and power regressions are used to determine the regression equation for each friction level of the UCS test results. The results of the regressions, i.e., the regression equations and the coefficient of determination R2, are shown in Fig. 7a. It can be seen from Fig. 7a that R2 = 0.75–0.89, meaning that 75–89% of the values fit the regression models. The coefficient of correlation R, defined as the square root of R2, is therefore R = 0.86–0.94. The range of R values from 0.86 to 0.94 tells us that for each interface friction, the linear and power regressions in Fig. 7a are able to capture the significant correlation between w/h ratio and the compressive strength of coal samples Sp. Once the regression is done, the following steps are carried out for each interface friction and regression type:
1. Calculate the compressive strength of the cubical coal specimen Su. This is done by entering w/h = 1 into each of the regression equations. Each of the equations is then normalized to the calculated Su. The results of these normalizations are shown in Fig. 7b, while the calculated Su are listed in Table 3.
2. Extrapolate the compressive strength of the cubical coal specimen Su to the compressive strength of the cubical coal pillar Scube. This is done by first finding the Gaddy factor K using Eq. (18) and then using the calculated K to find Scube using Eq. (19):
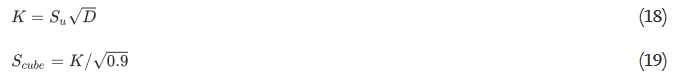
where D is the sample diameter or width, that is 0.076 m as used in Refs. 22,23. The square root of 0.9 m is used as this paper uses the SI unit. The original equation in Ref. 31 uses the square root of 36 in as Su, D, K and Scube are in British units. The calculated K and Scube for each interface friction and regression type are also listed in Table 3.
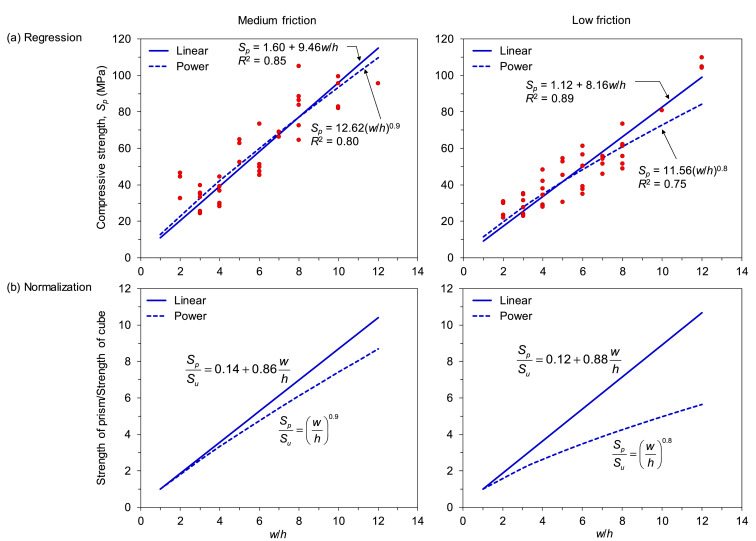
Fig. 7. Regression and normalization of the UCS test results.
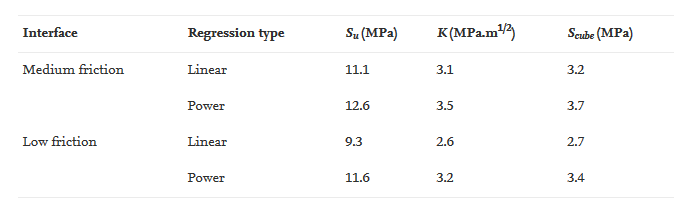
Table 3. Calculated Su, K, and Scube for each interface friction and regression type.
2.3. . New coal pillar strength formulae considering the effect of interface friction
Combining Fig. 7b and Table 3, the new coal pillar strength formulae considering the effect of interface friction can now be expressed.
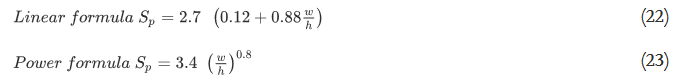
For the medium interface friction, the formulae are expressed as
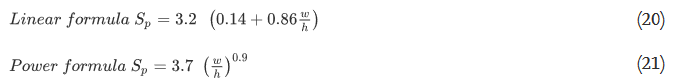
while for the low interface friction, the formulae are expressed as
To see the behavior of the new coal pillar strength formulae in light of existing empirical formulae, the new formulae in Eqs. (20), (21), (22), (23) are compared to the several representative empirical formulae of the linear and power forms. The comparison uses the same parameters used in Section 1.1, as shown in Table 2.
In the group of linear formulae (Fig. 8a), the predicted strengths from the medium- and low-friction formulae are close to the Mark-Bieniawski5 formula; the medium-friction formula predicts the largest strength among the other linear formulae in Fig. 8a. In the group of power formulae (Fig. 8b), the predicted strength from the medium friction is also the largest among the other power formulae starting from w/h = 16, exceeding that from the Greenwald7 formula at this ratio. On the other hand, the predicted strength from the low-friction formula is between those from the UNSW16 and Greenwald7 formulae.

Fig. 8. The new coal pillar strength formulae among the current empirical formulae.
2.4. . Justification of the approach
It is well known that laboratory testing on coal and rocks always shows that larger specimens give lower strength values than smaller specimens. This is because more discontinuities are present in larger specimens that in smaller specimens. Even though it is very expensive to perform a large number of in-situ coal pillar strength tests, the results of laboratory tests at the cm-scale should be used with caution to predict the actual coal pillar strength at the meter-scale. If no extrapolation or other upscaling approach is performed, laboratory tests on small-size coal samples should then be used for comparative purposes only.10,32
Fortunately, pioneer researchers31,33 found a critical cubical coal pillar above which coal pillar strength does not vary with size. This critical cubical coal pillar is defined as a coal pillar with side dimension of 0.9 m. This finding makes it possible to determine coal pillar strength by testing a sample cube with a size of 0.9 m. If the sample’s side dimension is less than 0.9 m, the suggested extrapolation approach by31,33 should be used to determine coal pillar strength. This suggested approach is the same used in this paper (Section 2.2). As can be seen in Fig. 8, the calculated Scube in this paper falls slightly below the Scube predicted in other pillar strength formulae because the influence of interface friction is now considered in the new formulae. Hence, it can be seen that this paper has followed the correct approach to develop coal pillar strength formulae from laboratory tests considering the influence of interface friction.
3. Comparison against stable and unstable pillar cases
The new coal pillar strength formulae in Eqs. (20), (21), (22), (23) are now compared against a database of stable and unstable pillar cases from around the world. This comparison is made for two reasons:
1. To evaluate the suitability of the new pillar strength formulae against a real-world database, and
2. To build confidence in the parametric values used in the new pillar strength formulae (Table 3) as a result of regression of laboratory test data.
A total of 636 cases are collected, consisting of 392 cases from South Africa34, 172 from the USA35, 38 from India14, and 34 from Australia. 16For the cases from South Africa, the database in this paper excludes the failure cases from the Vaal Basin, Klip River, and Free State coalfields as the coals from these coalfields are considered “weak coal”.34
3.1. . Comparison result
Fig. 9 presents the plots of stable and unstable pillar cases from around the world. In both cases, the strength of the pillar Sp is estimated as the applied pillar load σp. As can be seen from Fig. 9, in both the groups of linear (Fig. 9a) and power formulae (Fig. 9b), most of the estimated pillar loads in the stable cases are less than the estimated pillar strength. Conversely, most of the estimated pillar loads in the unstable cases are greater than the estimated pillar strength. This result is expected and is particularly true when the estimated pillar strength uses the low-friction formulae. Another interesting fact illustrated in Fig. 9 is that most of the unstable cases that fall under the estimated pillar strength are at w/h ≤ 6. While the modes of these pillar failures are unknown, this fact corresponds with the results of the coal bump research conducted by Prassetyo22 and Prassetyo et al.23, in which it was found that small pillars of less than w/h = 6 are more prone to fail violently than big pillars.
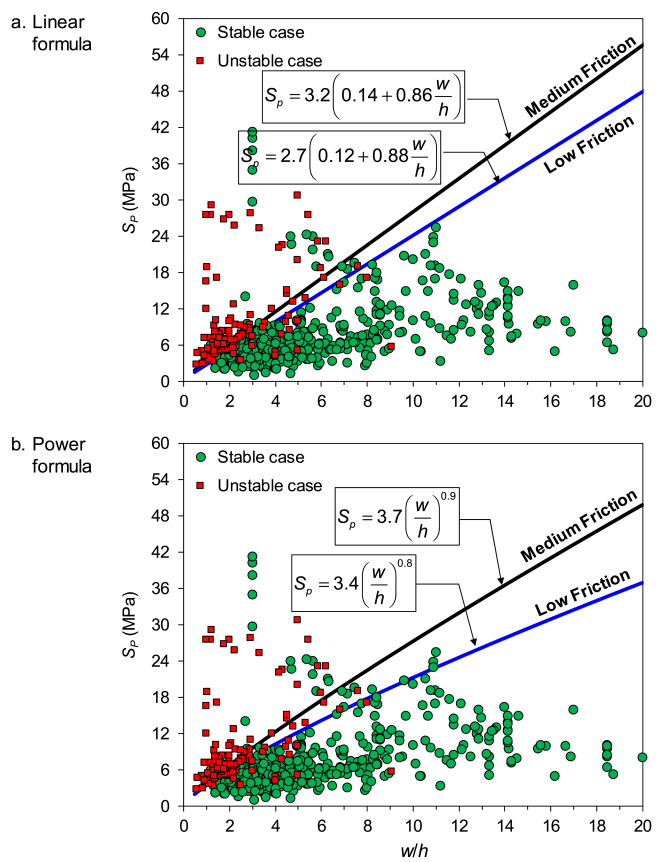
Fig. 9. Comparison of the new strength formulae against stable and unstable pillar cases from around the world.
Fig. 10 classifies the satisfactory level of the pillar strength prediction from the new formulae. The pillar strength prediction is called:
• Satisfactory when the estimated pillar strength from the new formulae is greater than the estimated pillar loads in the stable cases or less than the estimated pillar loads in the unstable cases.
• Unsatisfactory when the estimated pillar strength from the new formulae is less than the estimated pillar loads in the stable cases or greater than the estimated pillar loads in the unstable cases.
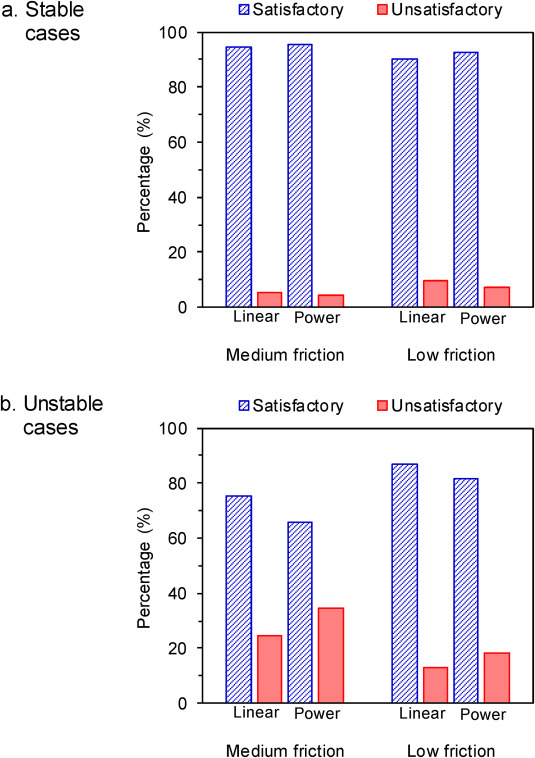
Fig. 10. Bar chart showing the comparison of satisfactory and unsatisfactory pillar strength predictions using the new pillar strength formulae for stable and unstable pillar cases from around the world.
Note that the terminology “Satisfactory” or “Unsatisfactory” is used to classify the satisfactory level of the pillar strength prediction from the new formulae, not the satisfactory level of the pillar designs from the stable and unstable cases.
It can be seen from Fig. 10 that for the stable cases, the satisfactory predictions from the new formulae are relatively similar, that is around 90–96% (456–483 stable cases), while the unsatisfactory predictions are around 4–10% (22–49 stable cases). On the other hand, for the unstable cases, the satisfactory predictions from the new formulae are only 66–87% (86–114 unstable cases), while the unsatisfactory predictions are around 13–34% (17–45 unstable cases). The detailed percentages and numbers of cases of the satisfactory and unsatisfactory pillar strength predictions are presented in Table 4.
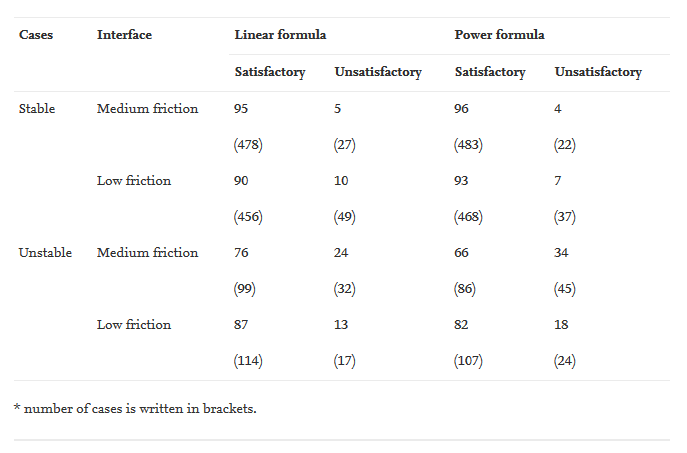
Table 4. Percentage of the satisfactory and unsatisfactory pillar strength predictions for all pillar cases from around the world.
The focus of the discussion is now switched to the unsatisfactory prediction in the unstable cases because this type of prediction is critical to assess the suitability of the new formulae in predicting collapse cases from a real-world database. The unsatisfactory prediction of the unstable cases tells us that the estimated pillar loads in the unstable cases are less than the estimated pillar strength from the new formulae. A higher percentage of unsatisfactory predictions in the unstable cases means a lower suitability and confidence level of the new pillar strength formulae.
The preceding paragraph mentioned that the new pillar strength formulae fail to predict pillar strength in the unstable cases by 13–34% (17–45 unstable cases). In terms of the interface friction, the low-friction formulae have lower unsatisfactory prediction in the unstable cases than the medium-friction formulae. In terms of the equation forms, the formulae of the linear form have lower percentages of unsatisfactory prediction in the unstable cases than the formulae of the power form. For the linear formulae, the percentages of unsatisfactory prediction in the unstable cases are 13% (17 unstable cases) and 24% (32 unstable cases) for low and medium interface friction, respectively. For the power formulae, the percentages of unsatisfactory prediction in the unstable cases are 18% (24 unstable cases) and 34% (45 unstable cases) for the low and medium interface friction, respectively. This statistic tells us that the low-friction formula of the linear form provides the best representation of the pillar cases in the database.
Similar behavior also appears when the database is broken down into each country (Fig. 11). In the stable cases, the satisfactory predictions from the new formulae are relatively similar for both the medium- and low-friction formulae. In the unstable cases, the percentage of the unsatisfactory predictions from the medium-friction formulae are generally larger (9–42%) than those from the low-friction formulae (4–28%). Looking at the percentage of the unsatisfactory predictions in the unstable cases, India is the most suitable country to use the low-friction formulae, followed by South Africa, the USA, and Australia. In average, India has the lowest unsatisfactory prediction in the unstable cases (7%), followed by South Africa (14%), the USA (21%), and Australia (22%). Moreover, the formulae of the linear form have lower percentages of unsatisfactory prediction in the unstable cases than the formulae of the power form (see Fig. 12 and Table 5).
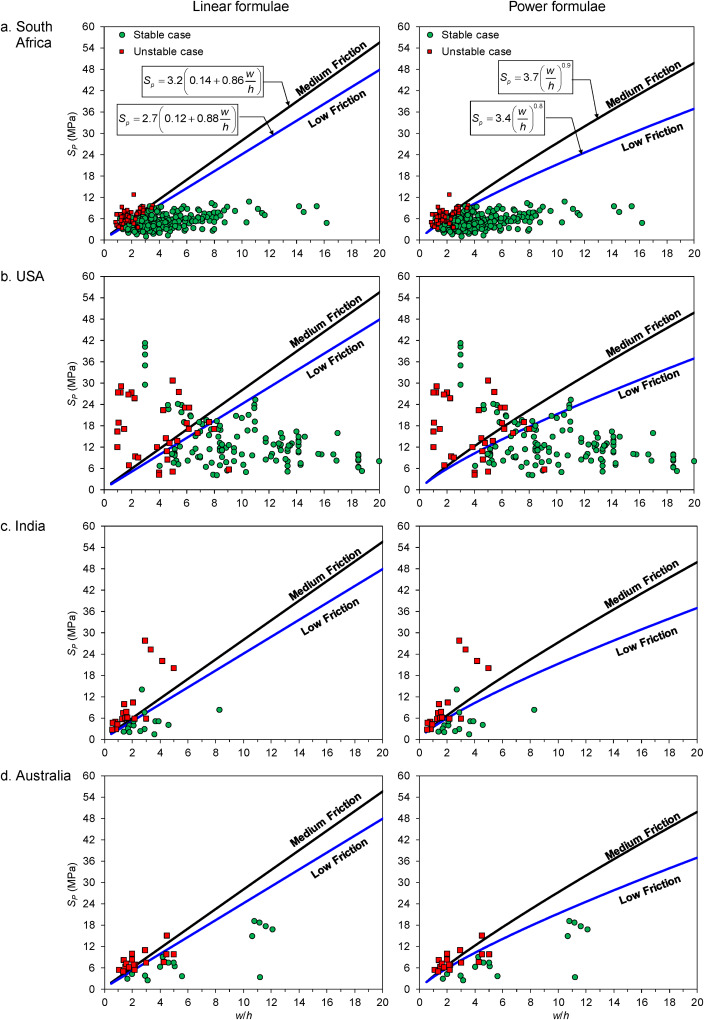
Fig. 11. Comparison of the new strength formulae against the stable and unstable pillar cases from each contry.
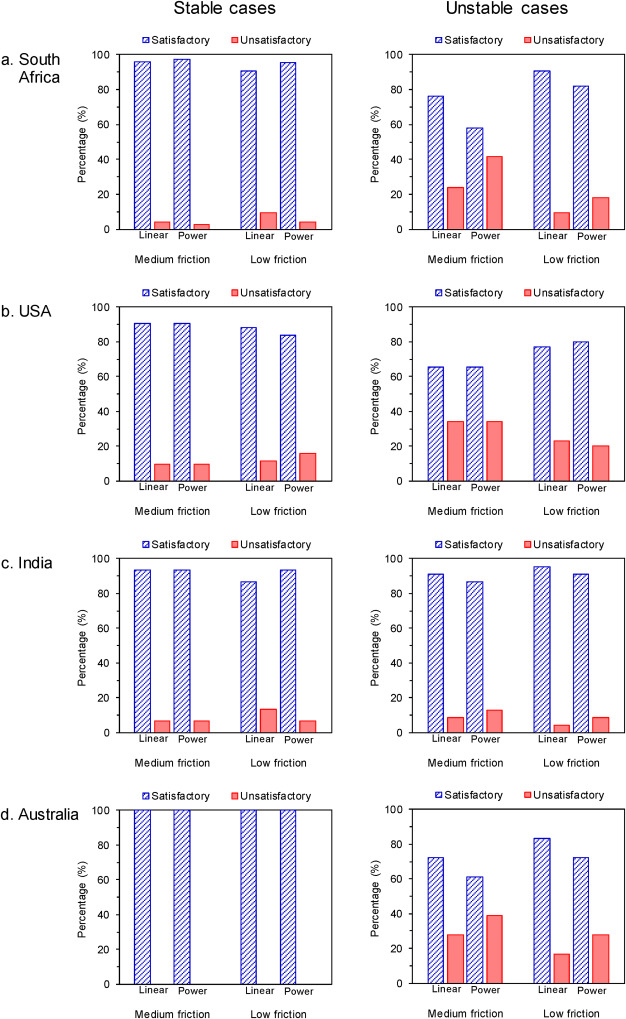
Fig. 12. Bar chart showing the comparison of satisfactory and unsatisfactory pillar strength prediction using the new pillar strength formulae for pillar cases from each country.
Table 5. Percentage of satisfactory and unsatisfactory pillar strength prediction using the new pillar strength formulae for pillar cases from each country.
| Country | Formula | Interface | Stable cases | Unstable cases | ||
|---|---|---|---|---|---|---|
| Satisfactory | Unsatisfactory | Satisfactory | Unsatisfactory | |||
| South Africa | Linear | Medium friction | 96 | 4 | 76 | 24 |
| (309) | (13) | (42) | (13) | |||
| Low friction | 90 | 10 | 91 | 9 | ||
| (291) | (31) | (50) | (5) | |||
| Power | Medium friction | 98 | 2 | 58 | 42 | |
| (314) | (8) | 32 | (23) | |||
| Low friction | 96 | 4 | 82 | 18 | ||
| (308) | (14) | (45) | (10) | |||
| USA | Linear | Medium friction | 91 | 9 | 66 | 34 |
| (124) | (13) | (23) | (12) | |||
| Low friction | 88 | 12 | 77 | 23 | ||
| (121) | (16) | (27) | (8) | |||
| Power | Medium friction | 91 | 9 | 66 | 34 | |
| (124) | (13) | (23) | (12) | |||
| Low friction | 84 | 16 | 80 | 20 | ||
| (115) | (22) | (28) | (7) | |||
| India | Linear | Medium friction | 93 | 7 | 91 | 9 |
| (14) | (1) | (21) | (2) | |||
| Low friction | 87 | 13 | 96 | 4 | ||
| (13) | (2) | (22) | (1) | |||
| Power | Medium friction | 93 | 7 | 87 | 13 | |
| (14) | (1) | (20) | (3) | |||
| Low friction | 93 | 7 | 91 | 9 | ||
| (14) | (1) | (21) | (2) | |||
| Australia | Linear | Medium friction | 100 | 0 | 72 | 28 |
| (16) | (0) | (13) | (5) | |||
| Low friction | 100 | 0 | 83 | 17 | ||
| (16) | (0) | (15) | (3) | |||
| Power | Medium friction | 100 | 0 | 61 | 39 | |
| (16) | (0) | (11) | (7) | |||
| Low friction | 100 | 0 | 72 | 28 | ||
| (16) | (0) | (13) | (5) | |||
* number of cases is written in brackets.
Even though the percentages of unsatisfactory prediction from the low-friction formulae are generally lower than those from the medium-friction formulae, from a practical standpoint, an unstable case is a very bad outcome that must be avoided, even if the design needs to be conservative. According to Mark36,37, from 140 pillar retreat case histories collected across the USA, satisfactory pillar designs were found when pillar safety factor SF ≥ 1.5. Starting from SF ≥ 1.5, the number of satisfactory pillar designs become significantly higher than the number of unsatisfactory pillar designs (e.g., slow pillar squeezes and sudden pillar collapses). In other words, only a few unsatisfactory pillar designs appeared when pillar SF is set to ≥1.5. Conversely, Mark36,37 found that when SF < 1.5, the number of unsatisfactory pillar designs becomes significantly higher than the number of satisfactory pillar designs.
Adopting this concept, SF ≥ 1.5 is now used to evaluate the satisfactory level of the predicted pillar strength from the new formulae. The pillar strength prediction is called:
• Satisfactory when the ratio of Sp/σp in the stable cases is ≥ 1.5 or when the ratio of Sp/σp in the unstable cases is < 1.5.
• Unsatisfactory when the ratio of Sp/σp in the stable cases is < 1.5 or when the ratio of Sp/σp in the unstable cases ≥1.0.
It should be noted that the percentages of satisfactory and unsatisfactory predictions that appear in Fig. 10, Fig. 12 and in Table 4, Table 5 are calculated based on SF = 1.0.
Fig. 13 presents bar charts showing the comparison of the satisfactory and unsatisfactory pillar strength predictions for the unstable cases from around the world for SF = 1.0 and 1.5. It can be seen that when SF = 1.5 is used, the percentages of the unsatisfactory predictions are greatly reduced to only 5–8% (7–10 unstable cases) for the medium-friction formulae and 4% (5 unstable cases) for the low-friction formulae (Table 6). These percentages are significantly lower than when SF = 1.0 is used (i.e., 24–34%, or 32–45 unstable cases) for the medium-friction formulae and 13–18% (17–24 unstable cases) for the low-friction formulae.
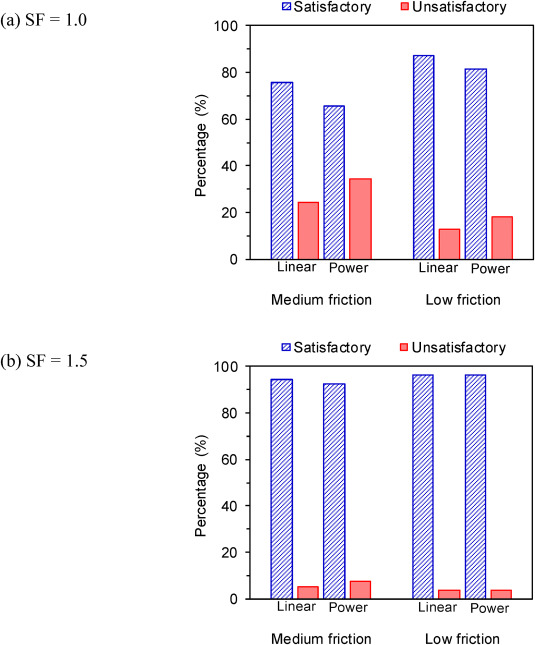
Fig. 13. Comparison of satisfactory and unsatisfactory pillar strength predictions for unstable pillar cases from around the world: (a) SF = 1.0 and (b) (SF = 1.5).
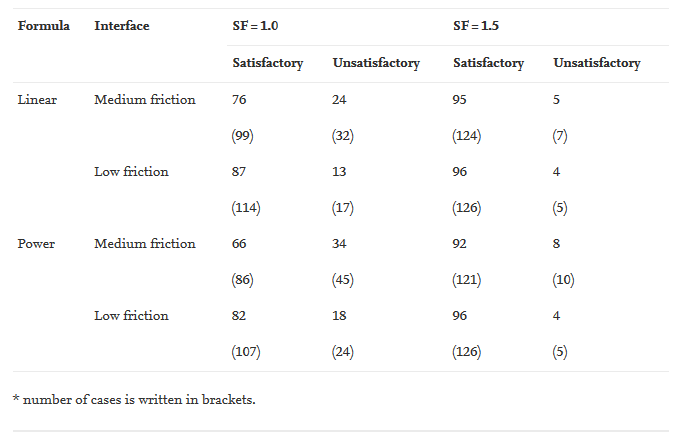
Table 6. Percentage of the satisfactory and unsatisfactory pillar strength predictions for the unstable pillar cases from around the world: SF = 1.0 vs. SF = 1.5
When considering the unstable cases from each country, the percentage of the unsatisfactory predictions can also be kept at a maximum of 14% for the medium-friction formulae and 11% for the low-friction formulae when SF = 1.5 is used. India and Australia are now the most suitable countries to use the low-friction formulae with SF = 1.5, followed by South Africa and the USA. On average, India and Australia have the lowest unsatisfactory prediction in the unstable cases (0%), followed by South Africa (2%) and the USA (11%) (see Fig. 14 and Table 7). Further observation of Table 7 reveals that when SF = 1.5 is used, the low-friction formula of the linear form provides the best representation of the pillar cases database.
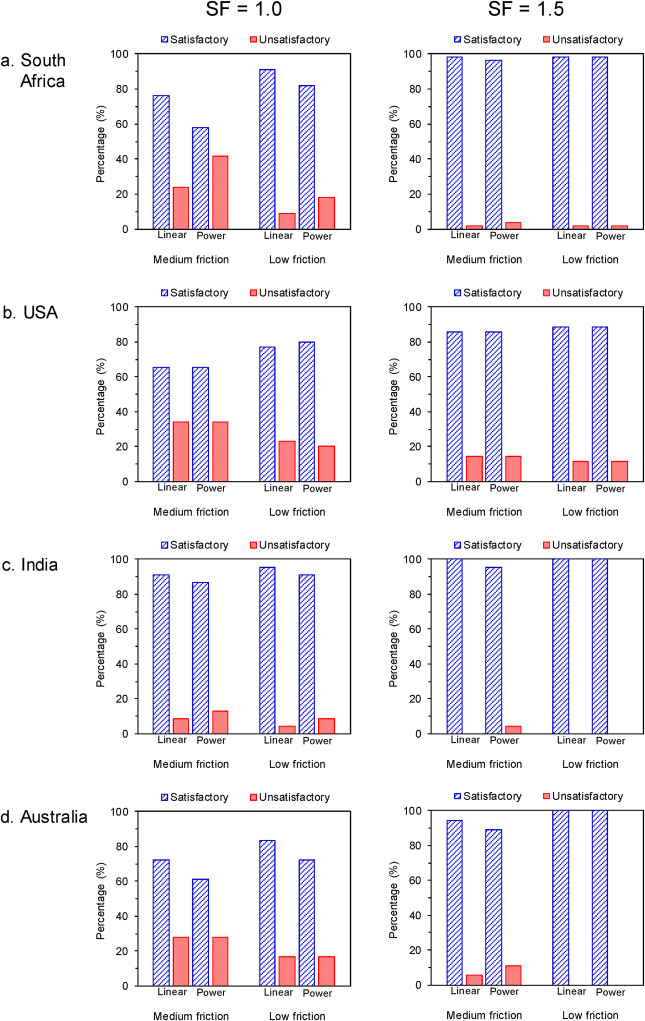
Fig. 14. Comparison of satisfactory and unsatisfactory pillar strength prediction for unstable pillar cases from each country for SF = 1.0 and SF = 1.5.
Table 7. Percentage of satisfactory and unsatisfactory pillar strength predictions for unstable pillar cases from each country: SF = 1.0 vs. SF = 1.5
| Country | Formula | Interface | SF = 1.0 | SF = 1.5 | ||
|---|---|---|---|---|---|---|
| Satisfactory | Unsatisfactory | Satisfactory | Unsatisfactory | |||
| South Africa | Linear | Medium friction | 76 | 24 | 98 | 2 |
| (42) | (13) | (54) | (1) | |||
| Low friction | 91 | 9 | 98 | 2 | ||
| (50) | (5) | (54) | (1) | |||
| Power | Medium friction | 58 | 42 | 96 | 4 | |
| (32) | (23) | (53) | (2) | |||
| Low friction | 82 | 18 | 98 | 2 | ||
| (45) | (10) | (54) | (1) | |||
| USA | Linear | Medium friction | 66 | 34 | 86 | 14 |
| (23) | (12) | (30) | (5) | |||
| Low friction | 77 | 23 | 89 | 11 | ||
| (27) | (8) | (31) | (4) | |||
| Power | Medium friction | 66 | 34 | 86 | 14 | |
| (23) | (12) | (30) | (5) | |||
| Low friction | 80 | 20 | 89 | 11 | ||
| (28) | (7) | (31) | (4) | |||
| India | Linear | Medium friction | 91 | 9 | 100 | 0 |
| (21) | (2) | (23) | (0) | |||
| Low friction | 96 | 4 | 100 | 0 | ||
| (22) | (1) | (23) | (0) | |||
| Power | Medium friction | 87 | 13 | 96 | 4 | |
| (20) | (3) | (22) | (1) | |||
| Low friction | 91 | 9 | 100 | 0 | ||
| (21) | (2) | (23) | (0) | |||
| Australia | Linear | Medium friction | 72 | 28 | 94 | 6 |
| (13) | (5) | (17) | (1) | |||
| Low friction | 83 | 17 | 100 | 0 | ||
| (15) | (3) | (18) | (0) | |||
| Power | Medium friction | 61 | 39 | 89 | 11 | |
| (11) | (7) | (16) | (2) | |||
| Low friction | 72 | 28 | 100 | 0 | ||
| (13) | (5) | (18) | (0) | |||
* number of cases is written in brackets.
Even when the low-friction formulae with SF = 1.5 is used, compared to that from other countries, the percentage of unsatisfactory predictions in the unstable cases from the USA appears to be higher, that is 11% or 4 out of 35 unstable cases. To further explore this finding, databases from around the world and the database from the USA only are compared in a w/h vs. SF plot (Fig. 15). Pillar SF is calculated using the linear form of the low-friction formula because the above findings show that the linear form of the low-friction formula is the most representative in predicting coal pillar strength. In general, the low-friction formula of the linear form has lower percentages of unsatisfactory prediction in the unstable cases than that of the power form.
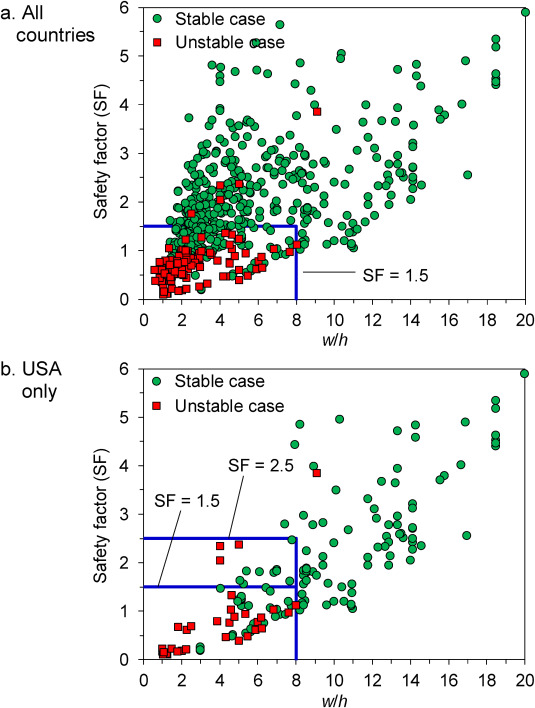
Fig. 15. Comparison of w/h ratio vs. SF for stable and unstable pillar cases between (a) all countries and (b) the USA only using low-friction formula of the linear form.
Considering the unstable cases from all countries (Fig. 15a), it can be seen that most of the unstable pillar cases are bounded inside the strength envelope of SF = 1.5. The exception is those from the USA (replotted separately in Fig. 15b). Considering the unstable cases from the USA only (Fig. 15b), one can see that higher SF up to SF = 2.5 is needed to achieve a higher percentage of satisfactory pillar design for pillars with w/h ≤ 6. For pillars with w/h > 6, SF = 1.5 is deemed sufficient to result in a stable pillar.
Another interesting fact shown in Fig. 15 is that most of the unstable pillar cases from all around the world occur to pillars with w/h ≤ 8. About 79% or 103 unstable pillar cases occur to pillars with w/h ≤ 4 (slender pillar) and about 21% or 28 unstable pillar cases occur to pillars with 4 < w/h ≤ 8 (intermediate pillar). There are no unstable pillar cases reported in the literature for pillars with w/h > 10 (squat pillar).
3.2. . Note on the use of the new pillar strength formulae
Section 3.1 reveals that the low-friction formula of the linear form provides the best representation of the stable and unstable pillar cases database. It should be noted that this new formula is derived based on a series of UCS tests on coal specimens carried out at different interface frictions and at w/h ratio up to 16. The comparison of this new formula against the field database is also only carried out up to w/h = 20. Thus, when using the new formula, readers should keep in mind the limitation of the w/h ratio at which the formula is derived and compared.
In doing so, when using the linear low-friction formula for pillars with w/h > 20, it is suggested that SF and pillar performance be verified using numerical simulation that considers the stress-strain relation of the coal pillar, the roof, the floor, as well as the coal/roof and coal/floor interfaces. In particular, the numerical simulation should be used to comprehensively observe:
• Pillar behavior that may enter the strain hardening mode after yielding as observed in laboratory tests for specimens with high w/h ratios (see Fig. 3).
• Progressive failure of a pillar that starts from the rib zone toward the transition zone and may continue to propagate toward the core zone, resulting in complete pillar failure.
With regard to the numerical analysis, the parametric values derived from the laboratory test in this paper (Table 3) could be used as a check on the appropriateness of the coal properties used in numerical models. While this numerical analysis is beyond the scope of this paper, this paper provides a combination of experimental (UCS tests on coal specimens at various interface frictions and w/h ratios), empirical (derivation of new pillar strength formulae), and observational methods (comparison against field cases) for predicting pillar strength. Thus, when the result of this paper is combined with numerical analysis, one may achieve an optimum pillar design approach.
4. Conclusions
This paper develops new coal pillar strength formulae considering the effect of interface friction. The formulae, which are in linear and power forms, are derived based on a series of UCS tests on coal specimens carried out at three different interface frictions and at ten width-to-height (w/h) ratios. The three interface frictions are regarded as high friction (c = 124 kPa and μ = 0.40), medium friction (c = 76 kPa and μ = 0.22), and low friction (c = 55 kPa and μ = 0.13), while the w/h ratios are at w/h = 2–8, 10, 12, and 16. The results for high friction are not included in the analysis because they lead to a very low correlation coefficient.
Combining the regression and normalization of the UCS test results, new coal pillar strength formulae considering the effect of interface friction are then developed and compared against a real-world database of stable and unstable pillar cases.
The results of this paper highlight three important messages:
(1) The low-friction formula of the linear form provides the best representation of the pillar cases database. In terms of the interface friction, the low-friction formulae have lower percentages of unsatisfactory prediction in the unstable cases than the medium-friction formulae. In terms of the equation forms, the formulae of the linear form have lower percentages of unsatisfactory prediction in the unstable cases than the formulae of the power form.
(2) To improve the pillar strength prediction, SF = 1.5 is suggested to be used for all pillar designs using the linear low-friction formula. Except for USA coal pillars, higher SF up to SF = 2.5 is suggested to achieve a higher percentage of satisfactory pillar designs for pillars with w/h ≤ 6 (slender pillar).
(3) When the friction of the coal/roof and coal/floor interfaces is not known, it is beneficial to assume that the interface has low friction value and thus to use the linear low-friction formula to predict pillar strength.
Having analyzed the results, it appears that the linear low-friction formula has the potential to be used concurrently with other pillar strength formulae or pillar design programs such as that developed by Mark and Agioutantis38 to achieve a satisfactory pillar design. However, when using the new formula, readers should keep in mind the limitation of the w/h ratio at which the formula is derived and compared against the field database.
Acknowledgements
The authors gratefully acknowledge a research grant from the Program of Research, Community Service, and Innovation of the Institut Teknologi Bandung (P3MI-ITB), fiscal year 2018. The authors also wish to thank Dr. Christopher Mark (the Principal Roof Control Specialist at MSHA-USA) and Dr. Rudrajit Mitra (the Chair of Rock Engineering at the School of Mining Engineering at the University of Witwatersrand, South Africa) for critically reviewing earlier drafts of the manuscript. Their thoughts and suggestions have substantially improved the technical and academic merits of this manuscript. In particular, Dr. Mark suggested the concept of coal pillar safety factor for the analysis in this paper.