

Shallow velocity structure near the CO2 injection well candidate of Gundih CCS Project derived from First Arrival Seismic Tomography
Rachmat Sule, Riskiray Ryannugroho, and Alfian Bahar
Geophysical Engineering, Institut Teknologi Bandung, Indonesia (rachmat.sule@gmail.com)
ABSTRACT
This paper presents the result of first arrival seismic tomography near Jepon-1, the candidate of CO2 injection well in Gundih CCS (Carbon Capture Storage) Pilot Project in Indonesia.
The forward-modeling problem was done by finite difference as the eikonal solver (Hole and Zelt, 1995). We applied regularized inversion technique (Zelt and Barton, 1998) to obtain the 3-D compressional velocity model in the study area. Initial velocity model was determined from a combination of travel time gradient calculation (intercept time) and velocity analysis from the seismic reflection processing routine. From the forward problem, we discovered that the raypath of seismic wave could dive until 200m beneath the surface. We also could resolve model with a dimension of 50 x 50 x 50 m3 with perturbation of 25% respect to background model which is successfully proved in checkerboard resolution test.
The result indicates that the uppermost layer has velocity range from 800 m/s – 1100 m/s with thickness of 5-10 m, which is composed of soil and weathered rocks. The underneath layer is composed of stronger rocks with velocity from 1200 – 1800 m/s. We also discovered that there is an anomaly of high velocity layer in 100 m depth with an approximate thickness of 40 – 70 m. From the resolved 3-D velocity model, we conclude that there is no indication of fracture in near-surface that could act as a pathway of injected CO2 to escape to the surface and/or weak zone that could be hazardous for CO2 injection activity and facility in the future.
KEY WORDS: seismic tomography, velocity model, shallow structure, carbon capture and storage (CCS), hazard mitigation.
INTRODUCTION
In 2016, a Pseudo 3-D seismic reflection survey was conducted in Gundih Area, Central Java, Indonesia (Figure 1). The survey was originally purposed to enhance information and knowledge of near-surface geological structure in Gundih CO2 injection site. condition for the planned seismic monitoring program. The effort was done by utilizing the first arrival seismic wave by using tomography technique (Zelt et al., 2006).
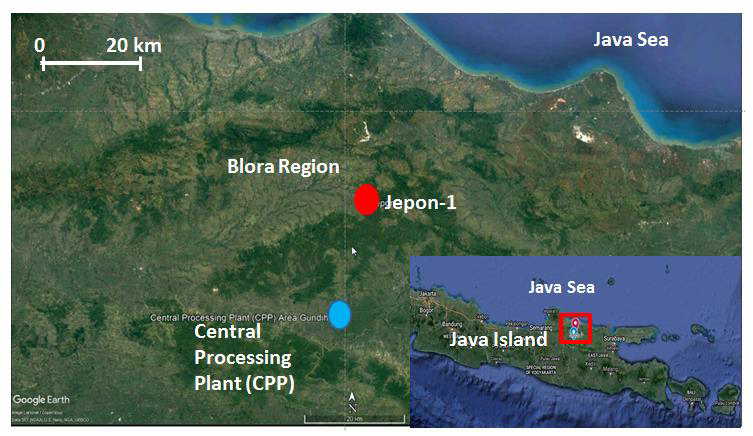
Figure 1. Location of Gundih CCS Pilot Project. Blue dot indicates the CPP (Central Processing Plant) location, and red dot is the CO2 injection well candidate. (taken from Asikin, 2018)
DATA ACQUISITION
Seismic source used in the survey was vibroseis truck. It was decided with the consideration that the source has a very good repeatability.
Total of 700 channels of geophone array were deployed with spacing of 10 m and 20 m. 501 vibration points were performed with spacing of 10 m (Figure 2). From all of the source point, only 99 points were included in tomography process since the limitation code in the software module. We are trying to improve the source code so that it could handle up to 999 shots.
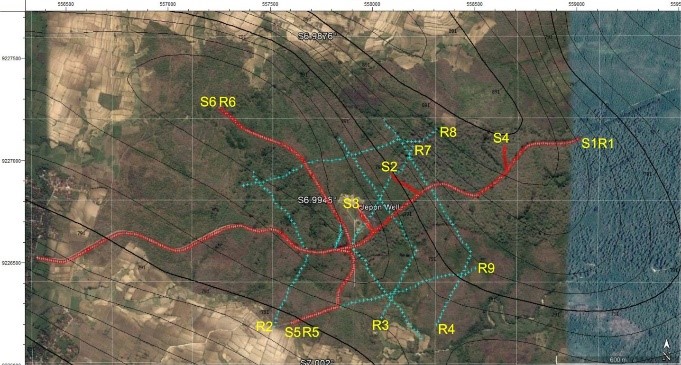
Figure 2. Source and receiver configuration in the survey. Source and receiver line are indicated in S and R preposition, respectively. The S1R1 line is located along the main road.
CONCLUSION
We had successfully obtained the near-surface 3-D velocity model in vicinity of Jepon-1, the candidate well of CO2 injection, using seismic tomography technique. We discovered that the ray could dive until 200 m of depth. The result shows that there is a high velocity anomaly layer in depth of 100 m with an approximate thickness of 40 – 70 m. There is no fault or weak zone detected in the tomogram that could risk the activity and/or the facility of CO2 injection. Further processing step and interpretation is set to be made in the full paper.
REFERENCES
- Asikin, A. R. K. (2018): CO2 Monitoring Prediction by Using Seismic Time Lapse Forward Modeling with Data from Simulation Reservoir Result: Case Study of Gundih Pilot Project Carbon Storage, Indonesia, Doctoral Dissertation, Institut Teknologi Bandung.
- Hole, J. A., and Zelt, B. C., 1995, Three-dimensional finite-difference reflection traveltimes, Geophysics. J. Int., 121, 427-434.
- Kearey, P., Brooks M., Hill I., 2002, An Introduction to Geophysical Exploration: Fundamentals, Blackwell Science, 21, ISBN 0-632-04929-4.
- Menke, R.R., 1989, Geophysical Data Analysis: Discrete Inverse Theory (Revised Edition), International Geophysics Series, Volume 45.
- Vidale, J., 1988, Finite-difference Calculation of Traveltimes, Bull. Seism.Soc.Am., 78:2062-2076.
- Vidale, J. E., 1990, Finite-difference calculation of travel times in three dimensional, Geophysics, 55, 521-526.v
- Zelt, C.A., Barton, P.J., 1998, Program Package for First Arrival Seismic Tomography, Rice Univercity, Houston.
- Zelt, C.A., Azaria, A., Levander, A., 2006, 3D seismic refraction traveltime tomography at a groundwater contamination site, Geophysics, Vol. 71, No.5 (September-October 2006); P.H67-H78