
Permeability Anisotropy Effect in Reservoir Characterization: New Rock Typing Approach
Dedy Irawan, Falza Izza Wihdany, Kharisma Idea
Department of Petroleum Engineering, Faculty of Mining and Petroleum Engineering, Institut Teknologi Bandung, Jalan Ganesha No. 10, Bandung 40132, Indonesia
Email: di@tm.itb.ac.id
Abstract
This study presents the effect of permeability anisotropy; maximum horizontal permeability (kx), horizontal permeability of 90o (ky), and vertical permeability (kz), in applying rock typing while only maximum horizontal permeability is commonly used for reservoir characterization. Samples from Berea sandstone (measured in laboratory), Nugget sandstone (published data), and Shannon sandstone (published data) are used in this study which are available for the value of kx, ky, and kz. Common rock typing method, Winland, HFU, GHE, and PGS were applied to classify the samples by using all tensor permeability with each pair of porosity at the same depth. Yet, with those methods, each permeability tensors shows a different classification even though they are from the same depth. Therefore, this study develops a general of rock grouping methods in which by using kx, ky, or kz will define a similar object. Furthermore, this paper provides a new approach in laboratory measurement to avoid anisotropic permeability miss prediction and an analytical solution for estimating ky. Calculation result with the proposed method yield satisfying result, while comparing to measurement data. Therefore, it can be applied to predict ky in the reservoir grid model while it is very rare to be measured and commonly ignored.
Keywords: Anisotropy permeability; anisotropy permeability prediction; core measurement; cube core plug; permeability distribution.
Introduction
The precipitation of rock and diagenesa process causes rock distribution to have various characteristic and influence the arrangement of grain of rock in all directions. This certainly influences the value of porosity and permeability, both horizontal and vertical permeability. In a still quite homogeneous formation, vertical permeability differs from horizontal permeability [1]. The vertical anisotropy effect is generally the result of the sedimentation environment and the compaction history after precipitation. In sandstone formations, grain size, shape factor, and orientation are important factors in the relation of vertical and horizontal permeability [1]. Nevertheless, the current anisotropy permeability can still be distributed mainly for 90o permeability even though this permeability value may vary greatly with the maximum horizontal permeability.
Generally, the porosity and permeability values of rock are obtained from the measurement of core samples in the laboratory. The process of measuring core samples in the laboratory uses a cylindrical core plug both horizontal core plug and vertical core plug. Frequently, horizontal core plugs and vertical core plugs are assumed have one equal porosity value. In fact, both of them may have different porosity and permeability values even though they are taken at the same depth.
Even though the sample at the same depth has different permeability value for x, y and z direction, they should still define the same object. This principle is like well log reading. In the same depth, each log tools has its own reading value, but it still defines an object in the form of porosity, water saturation, or permeability synchronously.
Therefore, the purpose of this study was to present the rock characterization by using all permeability anisotropy to prove the consistency of rock typing method. Moreover, this study also conducts tensor permeability prediction to enrich the reservoir characterization because so far 90o horizontal permeability are often ignored.
Method
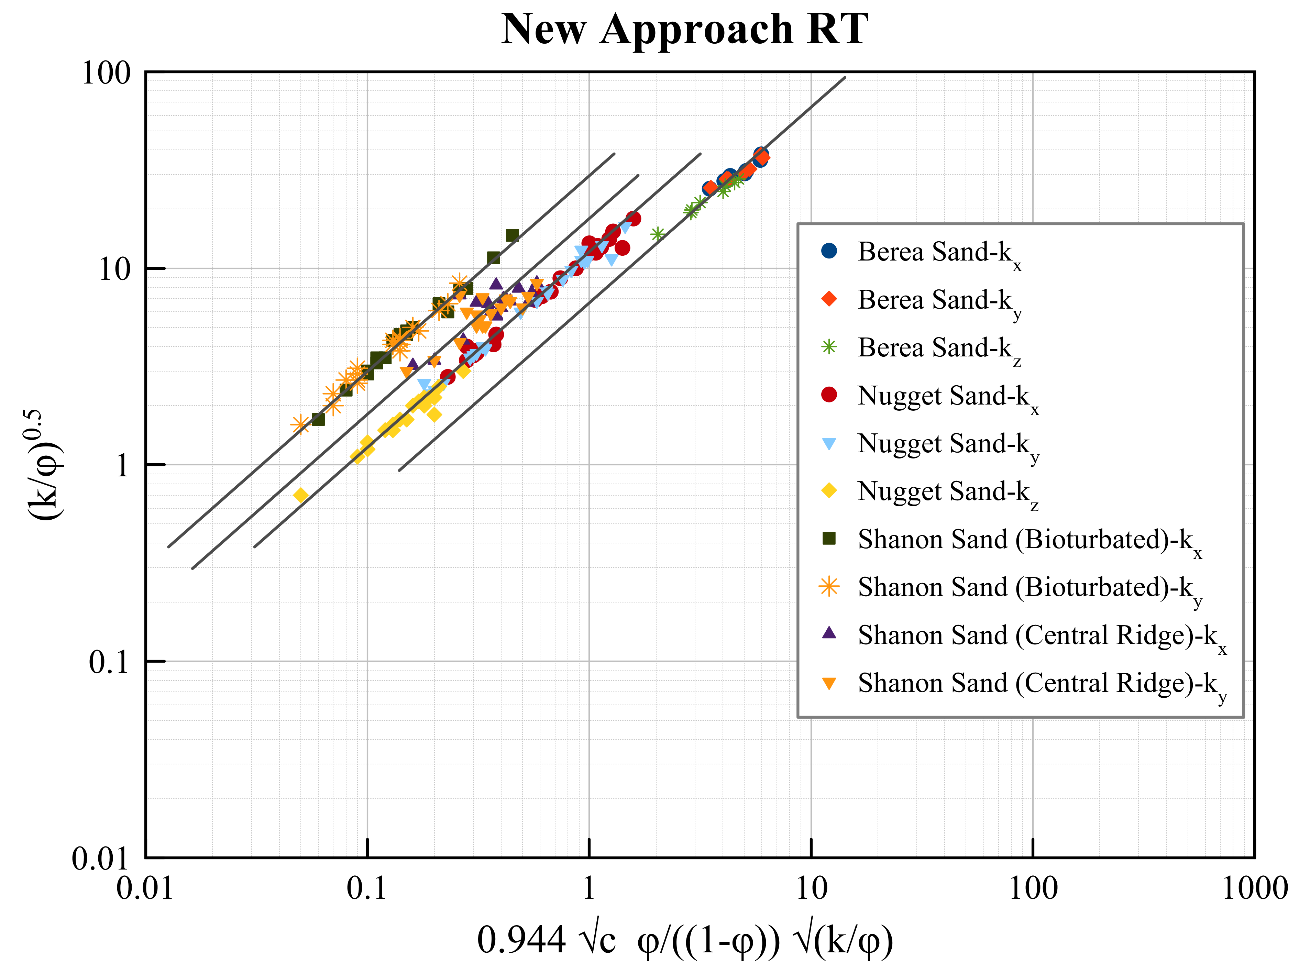
The workflow of this research is presented in Figure 1. Analysis in this study employs Berea core measurement data which are measured by researcher itself and published data by other researchers. The published data are from Cox et. al. (1994), Lishman (1970), and Tilman and Martinsen (1987). There are 23 core data of Nugget sandstone samples taken from Anschutz Ranch East Field, Wyoming (Cox et. al., 1994). All samples had porosity, maximum horizontal permeability, 90o horizontal permeability, and vertical permeability values. There were 25 cases result from numerical solution of Lishman’s observation [2], each cases has maximum horizontal permeability, 90o horizontal permeability and vertical permeability values, but there were no porosity values. Tilman and Martinsen’s experiment measured core from Shannon sandstone, Hartzog Draw Field. Their data had porosity, maximum horizontal permeability and 90o horizontal permeability.
First, rock type is qualified by four (4) typical methods; Winland, Hydraulic Flow Unit (HFU), Global Hydraulic Unit (GHE), and Pore Geometry-Structure (PGS). This study adopt an analytical approach derived from Kozeny’s equation and effective flow porosity (Mortensen et.al, 1998[3]) to develop a new approach of rock typing which covers permeability tensor and to model the relationship between tensor permeability (maximum horizontal permeability, 90o horizontal permeability, and vertical permeability). Through these equations, horizontal permeability predictions of 90o can be estimated in the absence of laboratory measurement data.
Core sample (1 ft length) from Berea sandstone is measured in Laboratory to obtain porosity and anisotropic permeability (kx, ky, and kz). In this study, the core plug is prepared cubically which is different with common core tube plug. The size of core plug is one inch. The objective of core measurement is to prove the influence of tensor in core measurement. The core cube plug is assumed could mimic the whole core and rock characteristic. The overview of core measurement is described in Figure 2.
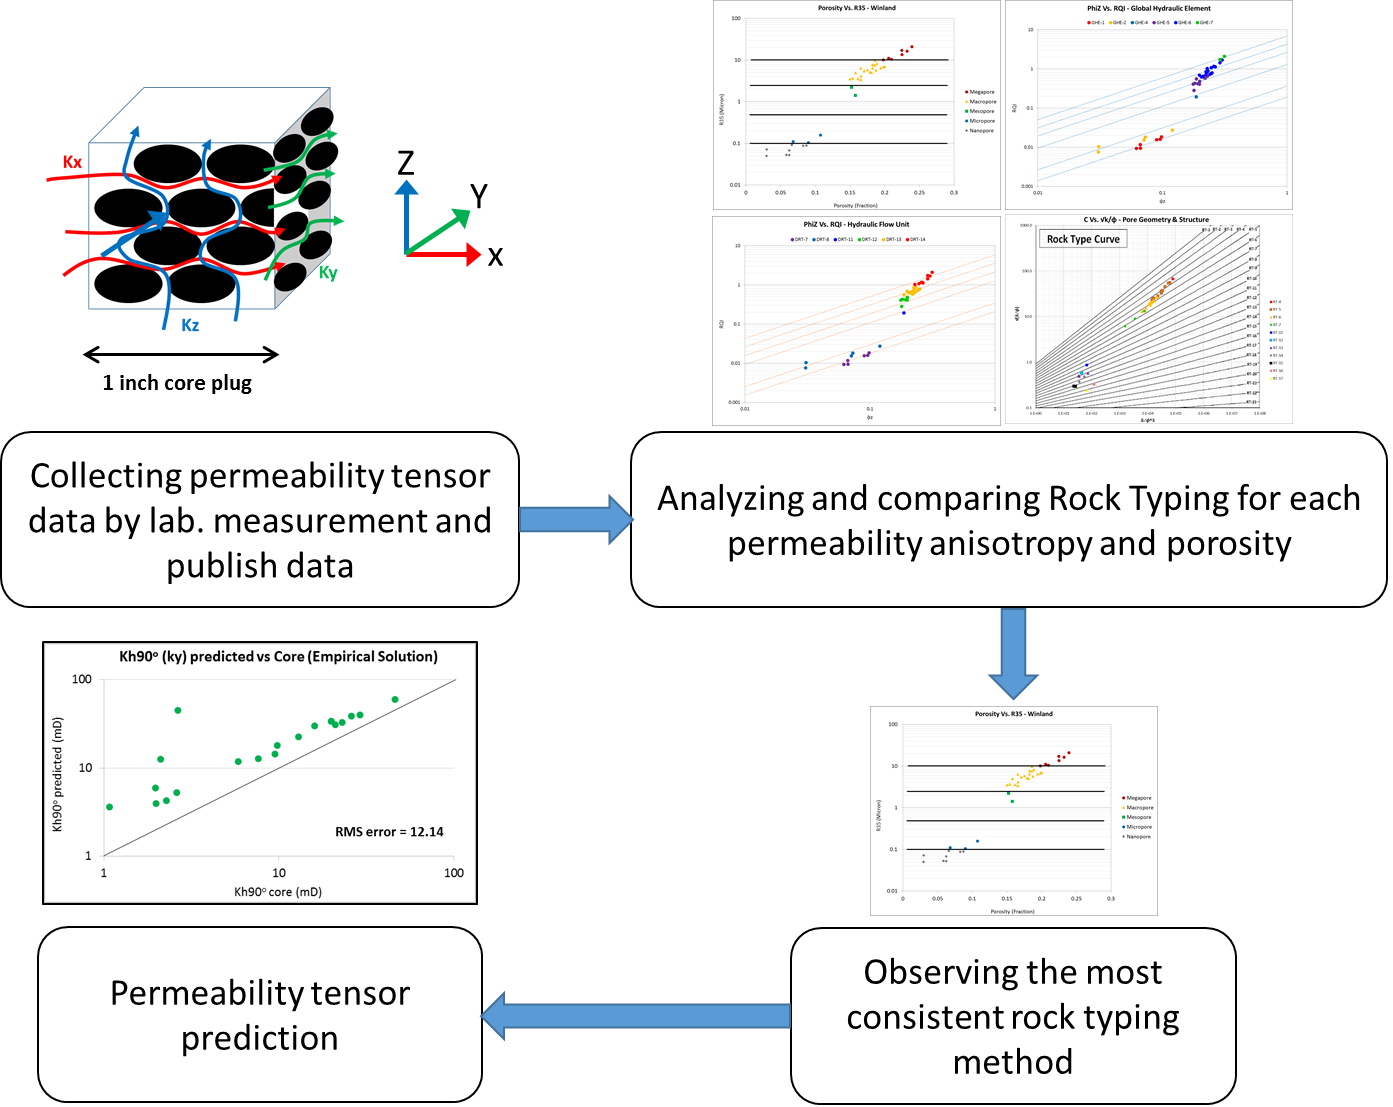
Figure 1 The workflow of this study
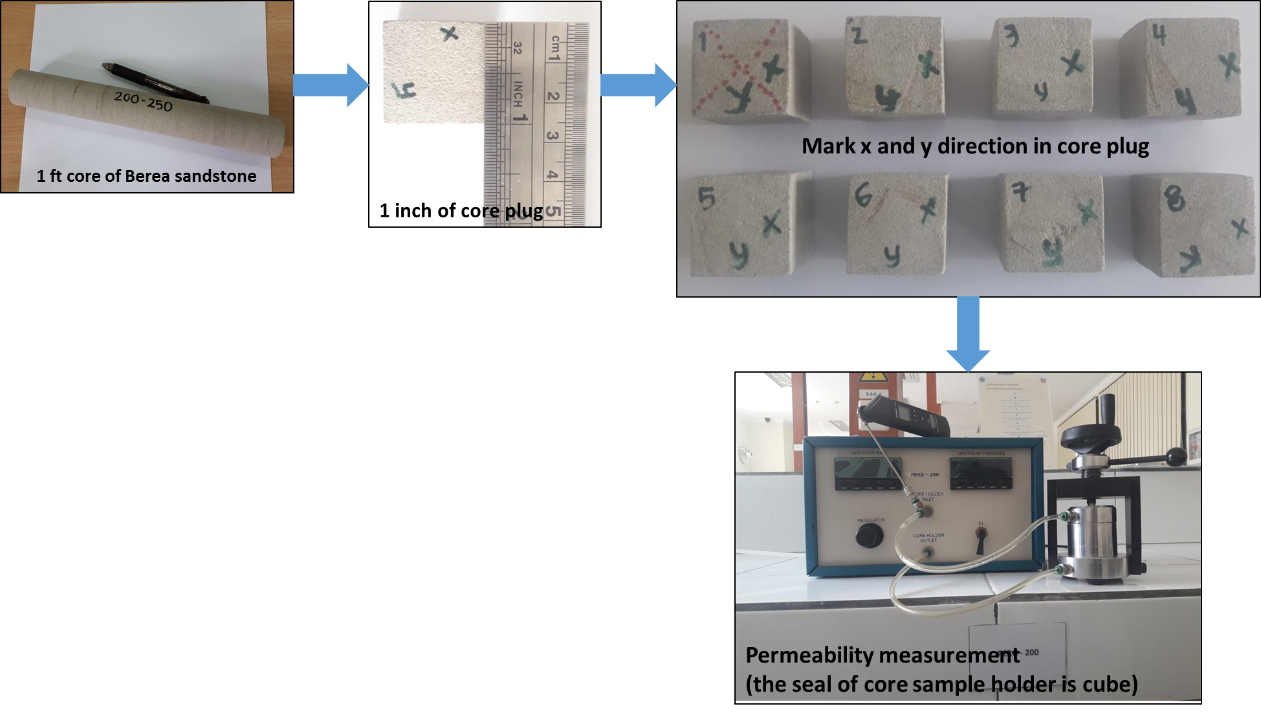
Figure 2 Core measurement of Berea sandstone