
The Application of Non-Linear Geostatistical Method for Predicting the Hydrothermal Fluid Flow Based on Geochemical and Resources Models on Cu-Au Porphyritic Deposit
Head of Team : Mohamad Nur Heriawan, ST., MT., Ph.D.
Team Members : Dr. Eng. Syafrizal, ST., MT. and Arie Naftali Hawu Hede, ST., MT., Ph.D.
This study focuses on interpretation of the hydrothermal fluid flow of Cu-Au porphyry deposit in northern Sulawesi. In general, the hydrothermal fluid flow pattern in Cu-Au porphyry deposit can be identified by looking at several parameters, such as: lithology domain, alteration zone, vein intensity, alteration intensity and distribution of metal grade. The 3D modeling of lithologic domains, alteration zones, vein intensity, alteration intensity and distribution of metal grade was using geostatistic (linear and non-linear) methods. From the results of each model, the spatial continuity was expected to illustrate the pattern of hydrothermal fluid flow.
The 3D modeling using geostatistical method (linear and non-linear) with data base obtained from XYZ prospect area, in the form of exploration drilling data totaling 58 core drill holes with an average spacing of ± 50 m and an average depth of 220 m. The dataset consists of elemental content (Cu, Au, Ag, Mo, Pb and Zn), lithology type, alteration type, vein intensity and alteration intensity. The 3D modeling of metal grade (Cu, Au, Ag, Mo, Pb and Zn) was done using Ordinary Kriging (OK), Sequential Gaussian Simulation (SGS) and Kriging Indicator (IK), while 3D lithology modeling, alteration, vein intensity and intensity alteration was done using Kriging Indicator (IK) method. Statistical analysis and variogram were performed to determine the parameters in estimation and simulation.
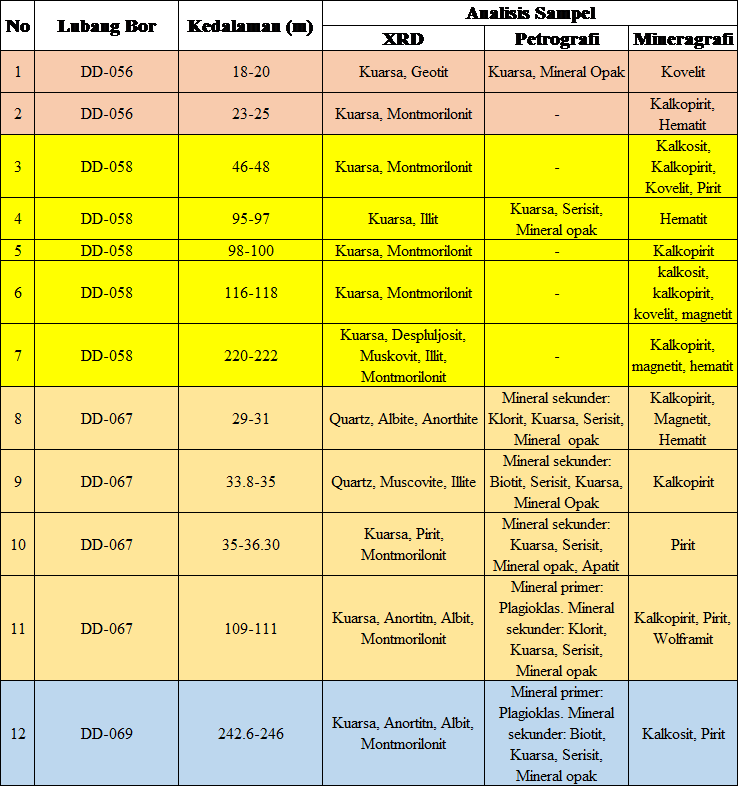
The determination of the alteration zone is distinguished by the mineral, temperature and pH of the hydrothermal solution (Morrison, 1997), in this case based on the results of the X-ray diffraction and petrography analysis from the drill core sample (Table 1). Based on the mineral content, the alteration zones were divided into five, i.e. (1) Potassium was characterized by the presence of secondary minerals (biotite and quartz), with temperatures ranging> 300oC, high salinity, (2) Phyllic was characterized by a set of secondary minerals dominated by sericite and quartz with a pH of neutral-acid and temperature of 200-400oC, (3) Propylitic was characterized by a set of secondary minerals (chlorite, quartz, albite and sericite) with a neutral-alkali pH and a temperature of 200-300oC, (4) Argillic was characterized by the presence of montmorillonite minerals with temperatures in the range <230oC, (5) Advanced argillic was found in the presence of metallic minerals, dominant quartz, but other minerals such as alunite, diaspore, pyrophyllite, along with quartz, calcedony, kaolinite were absent from thin section or X-ray diffraction analysis. The megascopic analysis found vuggy texture of quartz that characterized the advanced argillic alteration zone. As for the distribution model, Cu grade was estimated derived from the ore minerals such as, chalcopyrite, covellite and chalcocite. The distribution of Au and Ag itself could not be identified from the the observation of polished section analysis (mineragraphy).
Table 1. The results of X-ray diffraction analysis and microscopic observation
If we refer to the genetic of porphyry deposit where the increased vapor pressure and high temperature derived from the magmatic fluid passing through the fracture which then interacted with the wall rock which then formed the alteration zone. This can be used as an assumption for the interpretation and construction of hydrothermal fluid flow patterns. From each model that has been presented, we see that there was correlation of spatial model between alteration zone, Cu grade (cut-off 0.27%), vein intensity (1-10%), and alteration intensity. This then became the basis for interpretation and construction of hydrothermal fluid flow patterns. Fig. 2 shows the interpretation of enrichment zone of Cu grade, the vein intensity zone and alteration intensity overlaid against the alteration zone model. A fluid flow pattern construction followed the potassic alteration (K-feldspar-biotite-magnetite) model as an early indication of flowing hydrothermal fluid. The phyllic alteration zones (sericite and quartz) was located around the potassic zone due to the decreasing of temperature of hydrothermal fluid interacting with the wall rock. Then it developed the propylitic alteration zone (chlorite-carbonate +/- sulphide, epidote +/- hematite), argillic (illite-smectite-kaolinite, clay dominant +/- alunite) and advanced argillic alteration zone (silica capping – chalcedony, vuggy silica and silica replacement.
The idea of this research is to analyze the correlation of 3D geological model (lithology, alteration, vein intensity and alteration intensity) to elemental grade (Cu, Au, Ag) in determining the hydrothermal fluid flow pattern. The distribution of Cu grade showed the correlation of SGS model (> 0.20% Cu) similar to the IK model (> 0.27% Cu) where the spatial distribution model was continuously correlated with the lithology model (diorite group), alteration (potassic zone), the vein intensity (2-10%), and the alteration intensity (strong altered) which became the pattern of hydrothermal fluid flow.